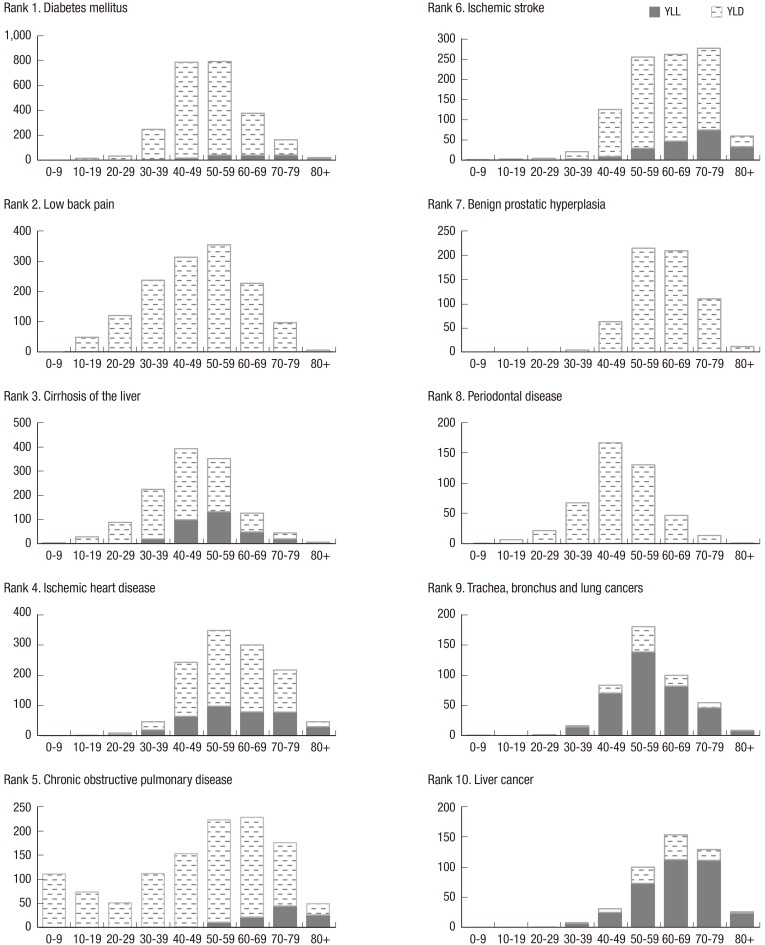
Fig. 3.
Top 10 causes of disability-adjusted life years (DALYs) with the YLL and YLD shares in males by age-group. X-axis: age group, Y-axis: DALYs per 100,000 males. The maximum value of the Y-axis was tailored to the distribution.
YLL, years of life lost due to premature mortality; YLD, years lived with a disability.

