. 2016 Oct 17;10(5):893–900. doi: 10.4184/asj.2016.10.5.893

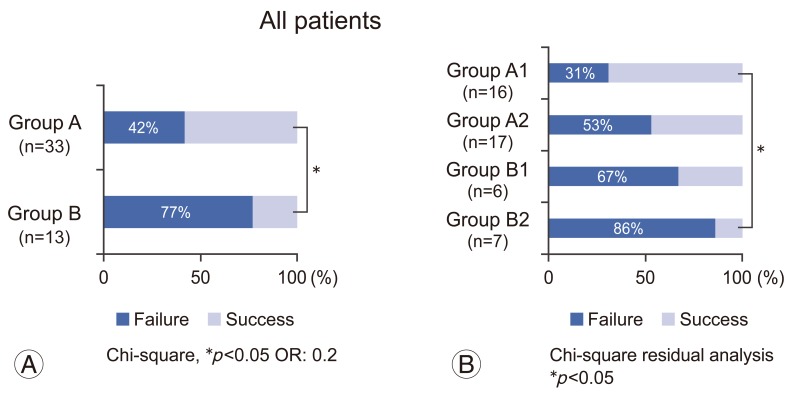
Fig. 2. Rates of treatment failure. (A) The treatment failure rate is significantly lower in group A (14/33, 42%) than in group B (10/13, 77%). (B) Subdivision comparison; the treatment failure rates are 31% (5/16) in group A1, 53% (9/17) in group A2, 67% (4/6) in group B1, and 86% (6/7) in group B2. Group A, 0° or more improvement of the rotation angle after the initial brace treatment; Group B, more than 0° deterioration of the rotation angle after the initial brace treatment; Group A1, B1, 30% or more improvement of Cobb angle after the initial brace treatment; Group A2, B2, less than 30% improvement of Cobb angle after the initial brace treatment.

Fig. 2