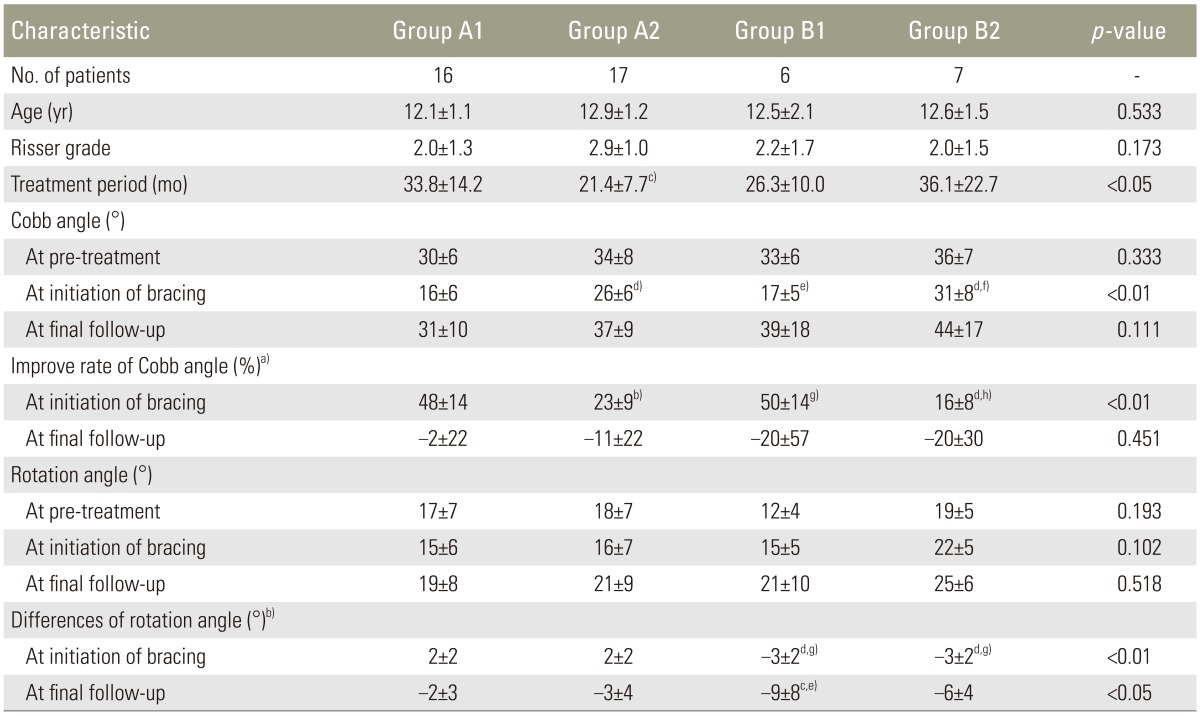
Table 2. Subdivided demographic data and comparison of measurement parameters.
The values are given as the mean and the standard deviation.
Group A1, 0° or more improvement of the rotation angle and 30% or more improvement of Cobb angle after the initial brace treatment; Group A2, 0° or more improvement of the rotation angle and less than 30% improvement of Cobb angle after the initial brace treatment; Group B1, more than 0° deterioration of the rotation angle and 30% or more improvement of Cobb angle after the initial brace treatment; Group B2, more than 0° deterioration of the rotation angle and less than 30% improvement of Cobb angle after the initial brace treatment.
a)Improve rate was calculated using the following formula: (Cobb angle at pre-treatment–Cobb angle at initiation of bracing or at final follow-up)/Cobb angle at pre-treatment×100%; b)Differences of rotation angle was calculated using the following formula: rotation angle at pre-treatment–rotation angle at initiation of bracing or at final follow-up; c)p<0.05 vs. Group A1; d)p<0.001 vs. Group A1; e)p<0.05 vs. Group A2; f)p<0.01 vs. Group B1; g)p<0.001 vs. Group A2; h)p<0.001 vs. Group B1.

