Figure 1.
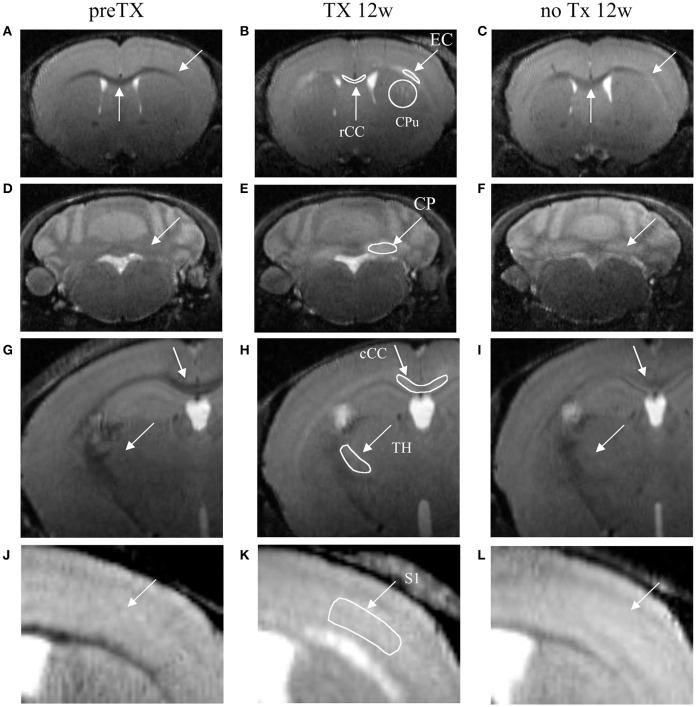
T2-weighted coronal images of the dynamics of demyelination/remyelination over the course of the pre-TX (A,D,G,J), 12w TX (B,E,H,K) and 12w no TX phases (C,F,I,L). Hyperintensities were detected after 12 weeks (12w) of TX in CPu, EC, and rCC (B); in CP (E); in TH and cCC (H); and in S1 (K). After 12 weeks without TX (C,F,I,L), the signal intensities decreased back. Manually-drawn regions of interest are shown in the middle panel in white.

