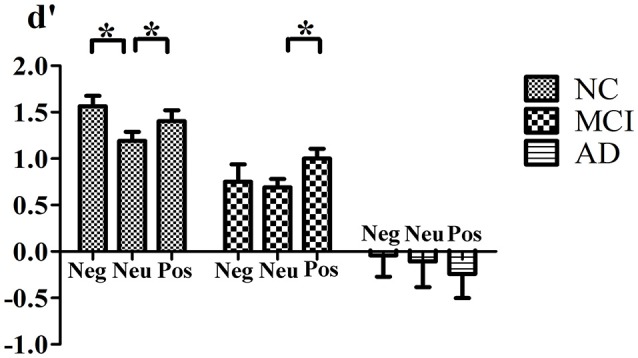
Figure 1.

Interaction of Valence × Group. Mean value of d′ index for negative, neutral and positive stimuli for normal control, MCI and AD patients. *Indicates significant statistic difference. Bars represent standard error. Abbreviations: Neg, negative; Neu, neutral; Pos, postitive.
