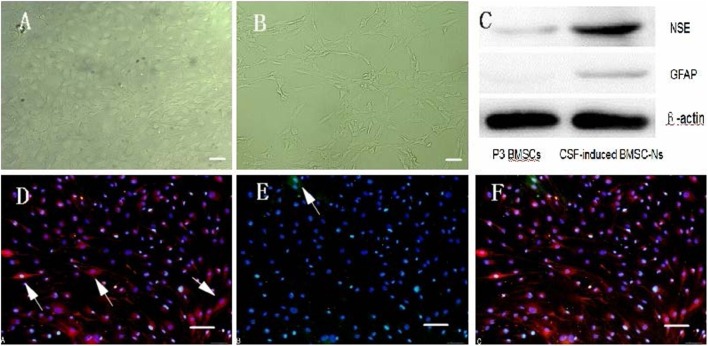
Figure 2.
Characteristics of hCSF-induced rat BMSC-differentiated neuron-like cells. (A,B) show post-induction by hCSF at day 1 and 4 (40×). Scale bar = 100 μm. (C) The protein levels were measured by a GELDOC instrument and normalized with respect to β-actin, which was chosen as an internal control. Each experiment was repeated at least three times. Variations in protein expression are given as arbitrary units. The expression of NES in cells induced by hCSF (0.43 ± 0.07) was significantly higher than that of P3-generation BMSCs (0.09 ± 0.03); meanwhile, GFAP also had small amount of expression (0.09 ± 0.02). However, P3-generation of BMSCs almost did not express GFAP (0 ± 0). (D–F) show Cells were positive for both NSE and GFAP, but expression levels for NSE were higher than GFAP. Western blot analysis of NSE and GFAP protein expression (200×). Scale bar = 100 μm.

