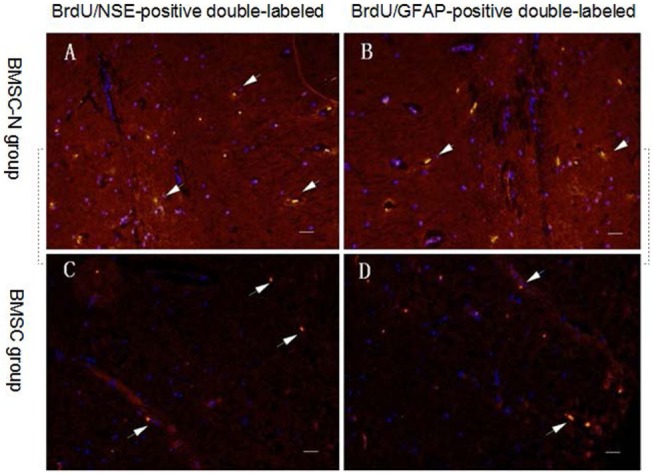
Figure 5.

Distribution of transplanted cells in the ischemic core of the brain on day 32 after transplantation in rats subjected to MCAO. Green labeling indicates BrdU-positive cells. DAPI (blue) labels nuclei. Immunofluorescent staining showing BrdU-positive transplanted cells (green) and NSE-positive cells (or GFAP-positive cells) (red). BrdU/NSE-positive double-labeled cells (or BrdU/GFAP-positive double-labeled cells) (yellow) (A,B) BMSC-N group; (C,D) BMSC group. The number of BrdU/GFAP-positive double-labeled cells or BrdU/NSE-positive double-labeled cells in the BMSC-N group was higher than that in the BMSC group. The BMSC-N group showed more BrdU/NSE-positive double-labeled cells than BrdU/GFAP-positive double-labeled cells. Conversely, the BMSC group had more BrdU/GFAP-positive double-labeled cells than BrdU/NSE-positive double-labeled cells. Significance levels are as shown in Table 3. Scale bar = 100 μm.
