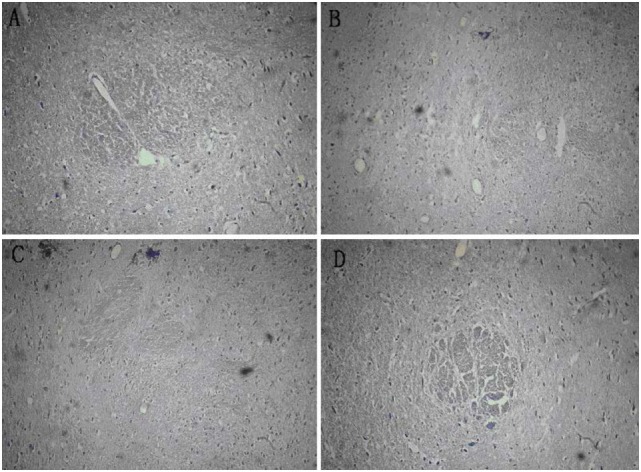
Figure 6.

Mensuration of infarct volumes in various groups before and after transplantation by HE staining. (A) The ratio of infarct area was 0.83% after modeling, (B) the ratio of infarct area was 0.38% in the BMSC-N group, (C) the ratio of infarct area was 0.51% in the BMSC group, and (D) the ratio of infarct area was 0.57% in the control group.
