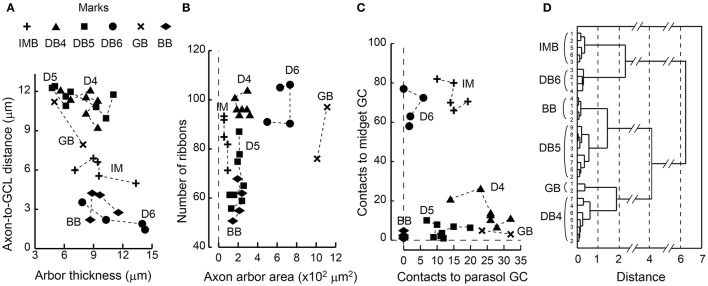
Figure 11.
Scatter plots of bipolar axon terminal counts and their clustering among the six ON bipolar cell types. (A) The relationship between the distance from the axonal tip to the ganglion cell layer and the thickness of the axonal arbor. (B) The relationship between the number of synaptic ribbons and the top-view area of an axonal arbor. (C) The relationship between the number of bipolar output contacts directed to MG cells and the number directed to PG cells. (D) Dendrogram of cluster analysis (Ward's method) of 30 ON bipolar cells using the six variables plotted in (A−C). All cases are uniquely clustered into six types.

