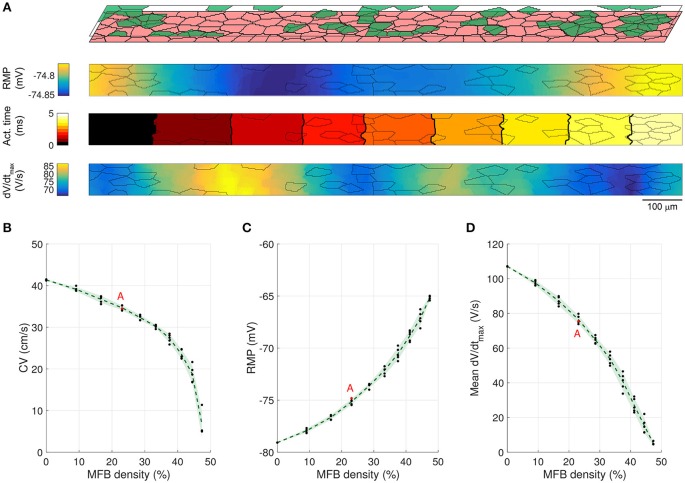
Figure 5.
Conduction in CMC strands with CMC-sized coating MFBs. (A) Structure of a computer-generated tissue and maps of the corresponding RMP, activation time (isochrone interval: 0.5 ms) and dV/dtmax. Coating MFBs (MFB density: 23%) are shown in green. In the maps, MFB cell borders are outlined in gray. (B–D) Effects of increasing MFB density on conduction velocity, mean RMP and mean dV/dtmax (black: individual results; green: mean ± SD, n = 5; red data point corresponds to the simulated tissue shown in A).

