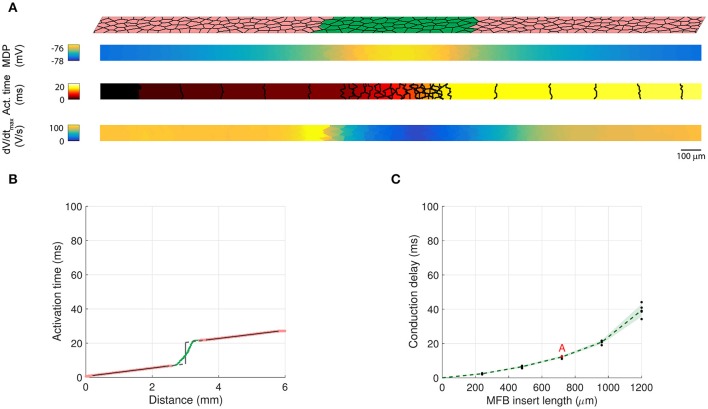
Figure 9.
Two CMC strand segments linked by an insert of CMC-sized MFBs. (A) Structure of a computer-generated tissue (insert length: 720 μm) and maps of the corresponding minimum diastolic potential (MDP), activation time (isochrone interval: 0.5 ms) and dV/dtmax. (B) Activation time along the structure shown in A, showing the activation delay between the two CMC segments (pink) linked by the MFB insert (green). (C) Dependence of the conduction delay on MFB insert length in different computer generated tissues (black: individual measurements, green: mean ± SD, n = 5; the simulation illustrated in A is labeled in red).

