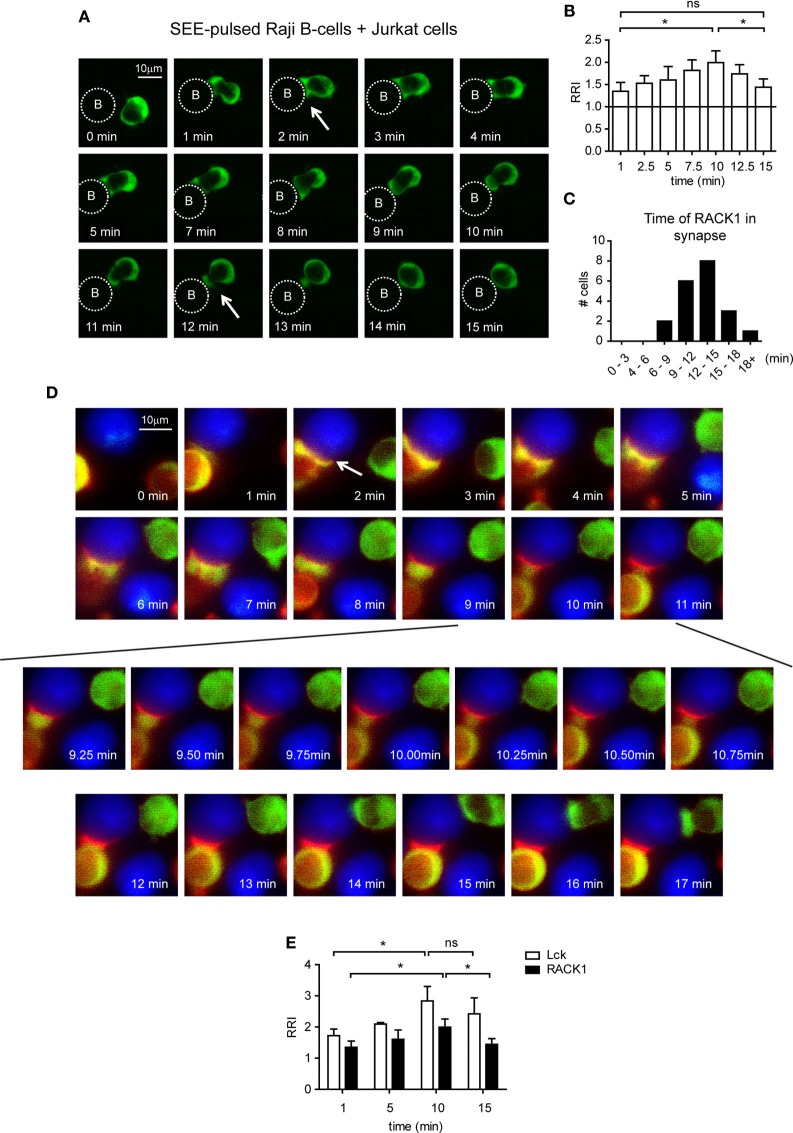
Figure 3.
The kinetics of Lck and RACK1 co-redistribution into forming immunological synapses (IS) in Jurkat T-cells. (A) Jurkat T-cells expressing RACK1–EGFP (green) were mixed with SEE-pulsed RAJI B-cells (denoted by the dotted circle), and the redistribution of RACK1 was observed by live cell imaging microscopy. Sequential time-lapse fluorescence microphotographs from one representative movie (Video S1 in Supplementary Material) are shown. (B) Statistical analysis of the kinetics of the relative recruitment index (RRI) of RACK1 to the forming IS measured after cell contact initiation (n = 20). (C) The bar graph shows the time distribution of RACK1 residency in IS; the start and end points of RACK1 residency are marked by two white arrows shown in (A); n = 20 cells. (D) Lck-deficient JCAM1.6 Jurkat T-cells co-expressing Lck–CFP (red) and RACK1–mCitrine (green) constructs were mixed with SEE-pulsed RAJI B-cells (blue). Their redistribution during the formation of IS was observed by live cell imaging microscopy. Sequential time-lapse fluorescence microphotographs from one representative movie (Video S2 in Supplementary Material) are shown. An arrow points to the forming IS. (E) Statistical analysis of the kinetics of the relative recruitment index (RRI) of RACK1 and Lck to the forming IS measured after cell contact initiation (n = 20).

