Figure 4.
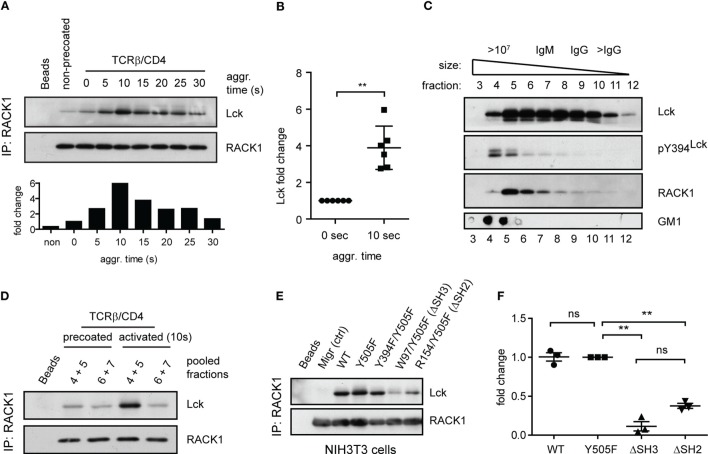
Antibody-mediated engagement of TCR/CD4 receptors induces RACK1–Lck complex formation in primary CD4+ T-cells. (A) CD4+ T-cells precoated or non-precoated with biotinylated anti-TCR and anti-CD4 mAbs (TCRβ/CD4) were co-aggregated, or not (0 s), with streptavidin for the indicated time. RACK1 immunoprecipitates were blotted against Lck and RACK1. The bar graph at bottom shows the relative amount of co-immunoprecipitated Lck after normalization to RACK1. (B) The graph plot presents the relative fold increase of co-immunoprecipitated Lck (10 s after activation) from six independent experiments. The statistical analysis presented as mean ± SD was performed using the Student’s two-tailed t-test, **p < 0.01. (C) RACK1–Lck interaction is localized into HMW fractions. CD4+ T-cells fractions (#3–12) obtained from a Sephadex column were probed with anti-Lck, anti-pY394Lck, anti-RACK1, and cholera toxin B subunit–HRP, which detects the surrogate marker of light DRMs, GM1. The fraction elution profile of the molecular weight size marker is shown on the top. (D) Fractions #4–5 and #6–7 from non-activated (precoated) or activated (TCRβ/CD4, 10 s) CD4+ T-cells were pooled, immunoprecipitated with anti-RACK1, and blotted with anti-Lck and RACK1 antibody. (E) RACK1–Lck interaction depends on functional SH2 and SH3 Lck domains. Endogenously expressed RACK1 was immunoprecipitated from NIH3T3 Lck infectants and blotted with anti-Lck and anti-RACK1 antibodies. (F) Statistical analysis of (E) represents the relative fold-change of RACK1 co-immunoprecipitated Lck variants from three independent experiments. The statistical analysis presented as mean ± SD was performed using the Student’s two-tailed t-test, **p < 0.01, n.s., not significant. Blots shown in (C–E) are representatives of at least three independent experiments.

