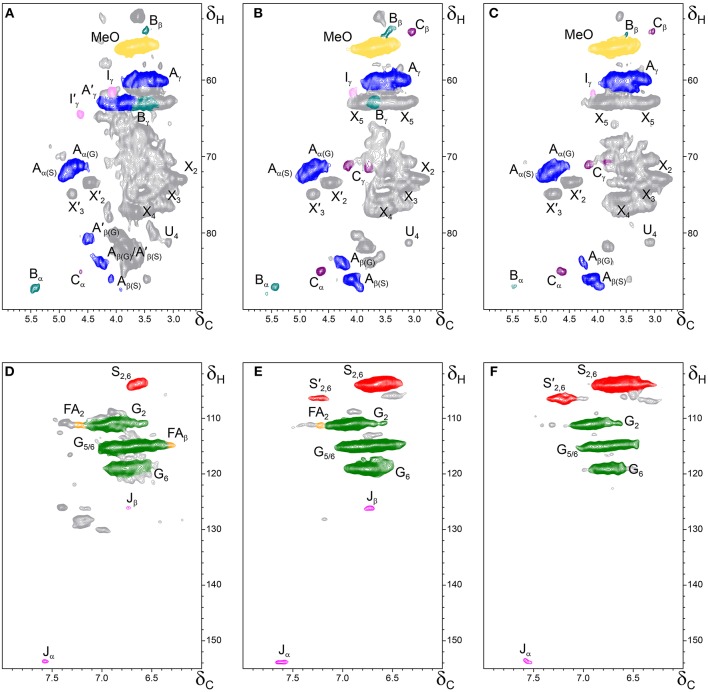
Figure 3.
Side-chain (δC/δH 50–90/2.5–6.0) and aromatic/unsaturated (δC/δH 100–155/6.0–8.0) regions in the 2D HSQC NMR spectra of the whole cell-walls from the different parts of Q. suber (A,D) cork, (B,E) phloem and (C,F) xylem. The signal assignments are presented in Table 3 and the main lignin structures identified are depicted in Figure 5.

