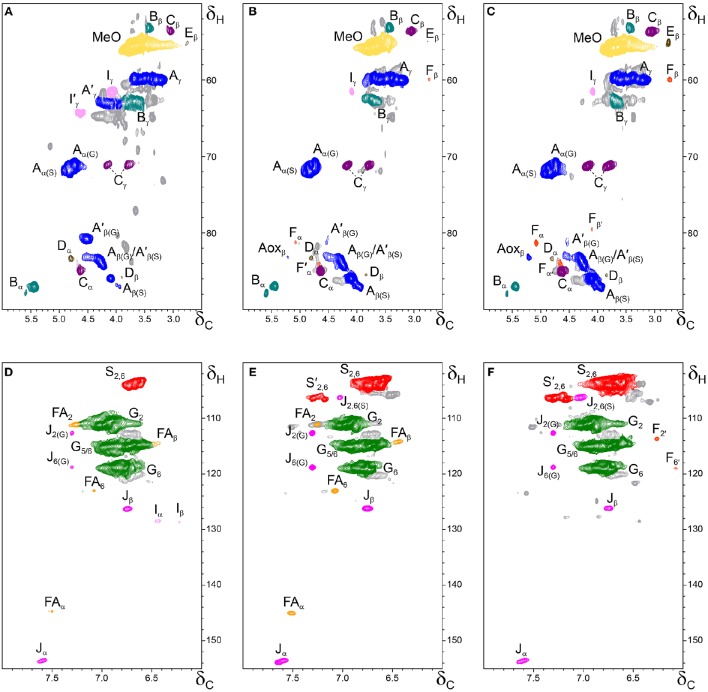
Figure 4.
Side-chain (δC/δH 50–90/2.5–6.0) and aromatic/unsaturated (δC/δH 100–155/6.0–8.0) regions in the 2D HSQC NMR spectra of the milled lignin preparations isolated from the different parts of Q. suber (A,D) cork, (B,E) phloem, and (C,F) xylem. The signal assignments are presented in Table 3 and the main lignin structures identified are depicted in Figure 5.

