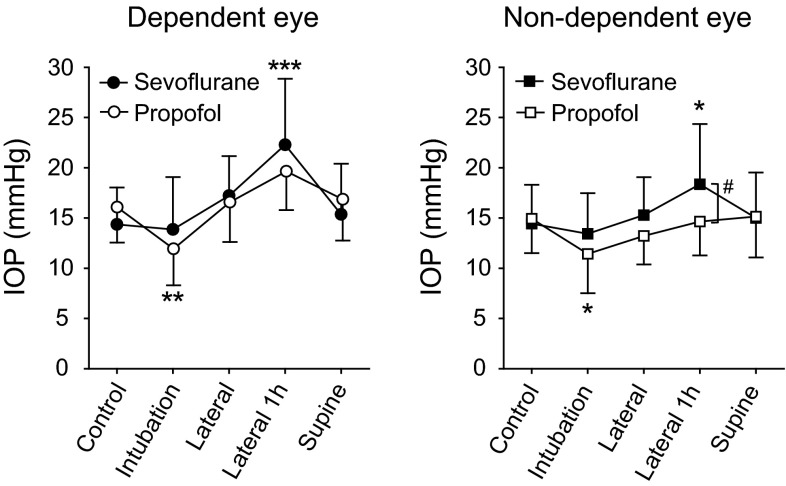
Fig. 1.
Changes in intraocular pressure (IOP) under sevoflurane and propofol anesthesia Open and solid circles indicate IOP measured in the dependent eye under sevoflurane and propofol anesthesia, respectively. Open and solid squares indicate IOP measured in the non-dependent eye under sevoflurane and propofol anesthesia, respectively. *P < 0.05. **P < 0.01, ***P < 0.001 versus control within a group. # P < 0.05 between sevoflurane and propofol groups

