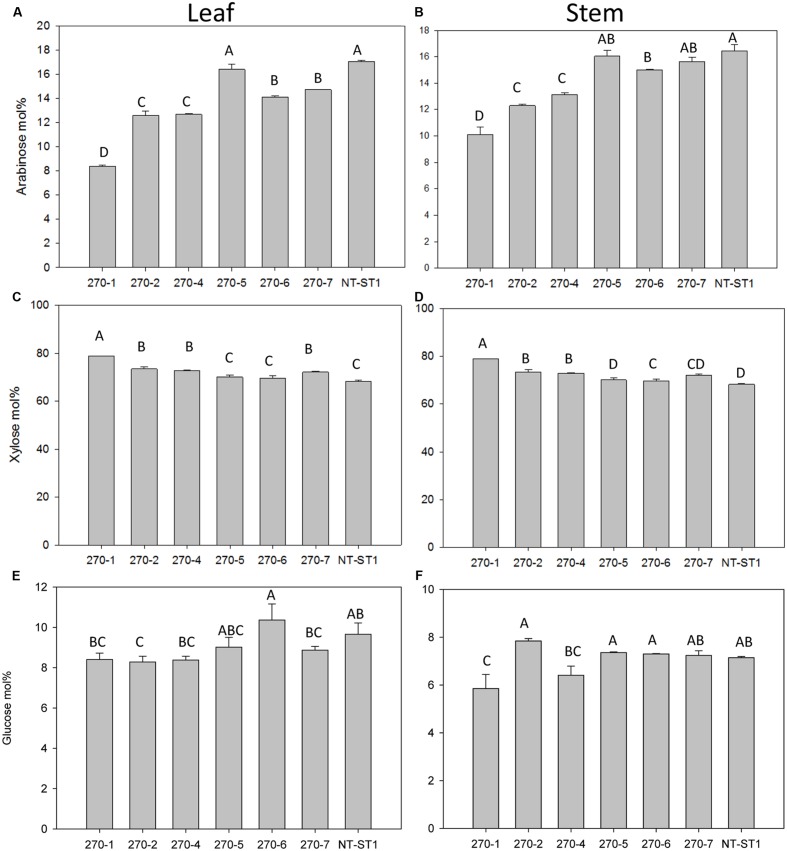
FIGURE 4.
Arabinose (A,B), xylose (C,D), and glucose (E,F) content in leaf (A,C,E) and stem (B,D,F) of transgenic and non-transgenic (NT-ST1) lines as determined by gas chromatography. Samples were normalized to internal standard (inositol) with mol% representing the % of total cell wall-associated sugars measured. Bars represent mean values of three biological replicates ± standard error. Bars represented by same letters are not significantly different as calculated by LSD (p ≤ 0.05).

