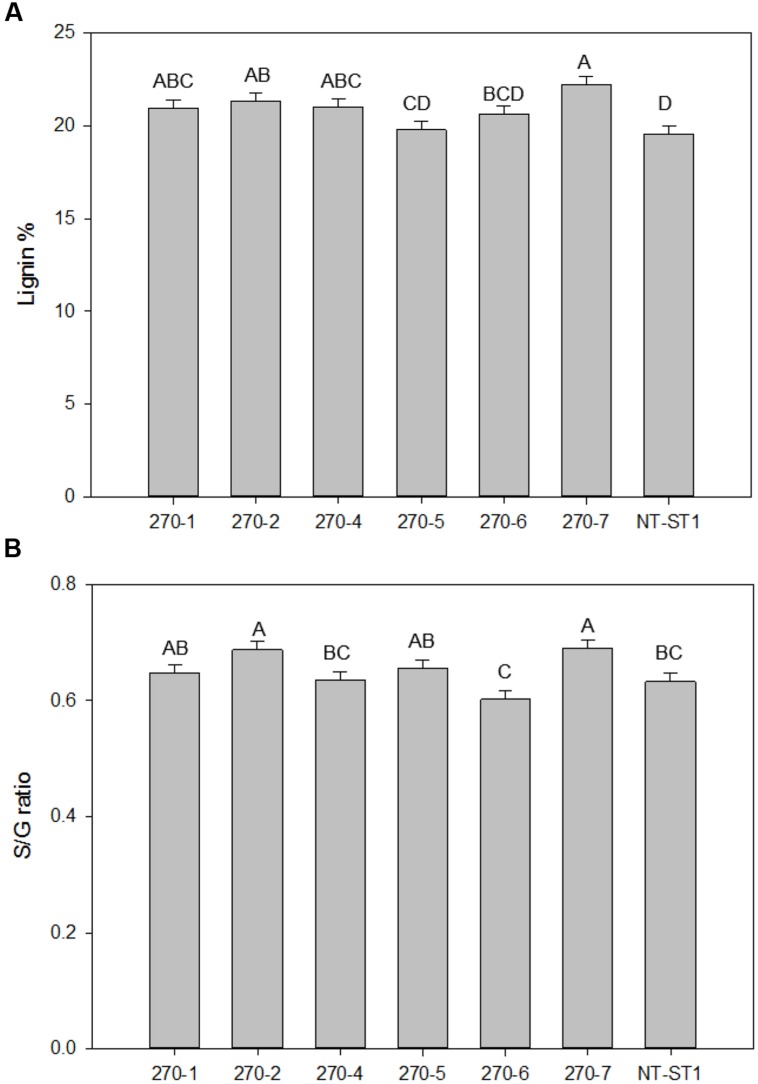
FIGURE 7.
Lignin content (A) and S/G ratio (B) of downregulated PvUAM1 transgenic and non-transgenic (NT-ST1) whole tiller cell wall residues as determined by PyMBMS. Bars represent mean values of three whole plant replicates ± standard error. Bars represented by same letters are not significantly different as calculated by LSD (p ≤ 0.05).

