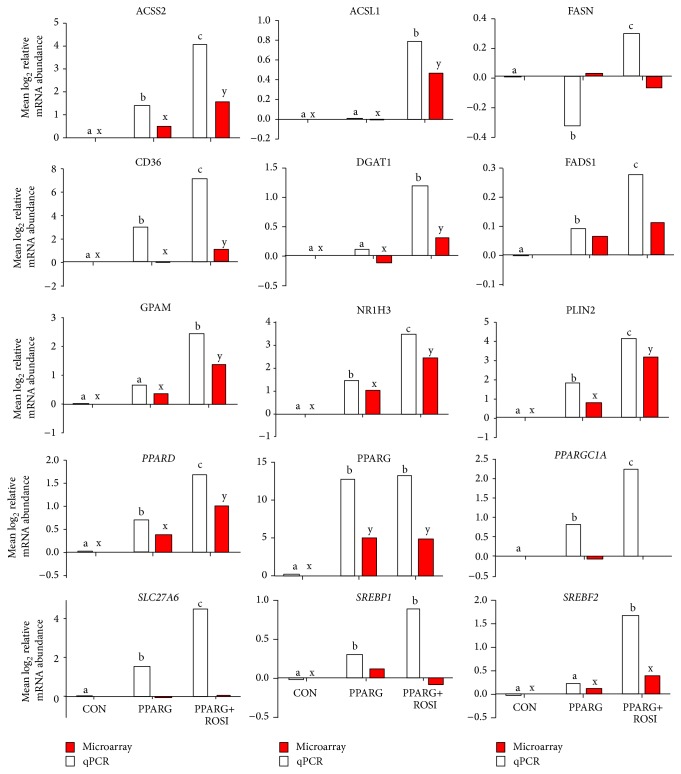
Figure 4.
qPCR analysis of selected transcripts and comparison with microarray data. Several of selected transcripts were present and differentially expressed among the comparison in the microarray data and qPCR. a, b, and c denote differences with P < 0.05 in qPCR data and x and y denote differences with P < 0.05 in microarray data.

