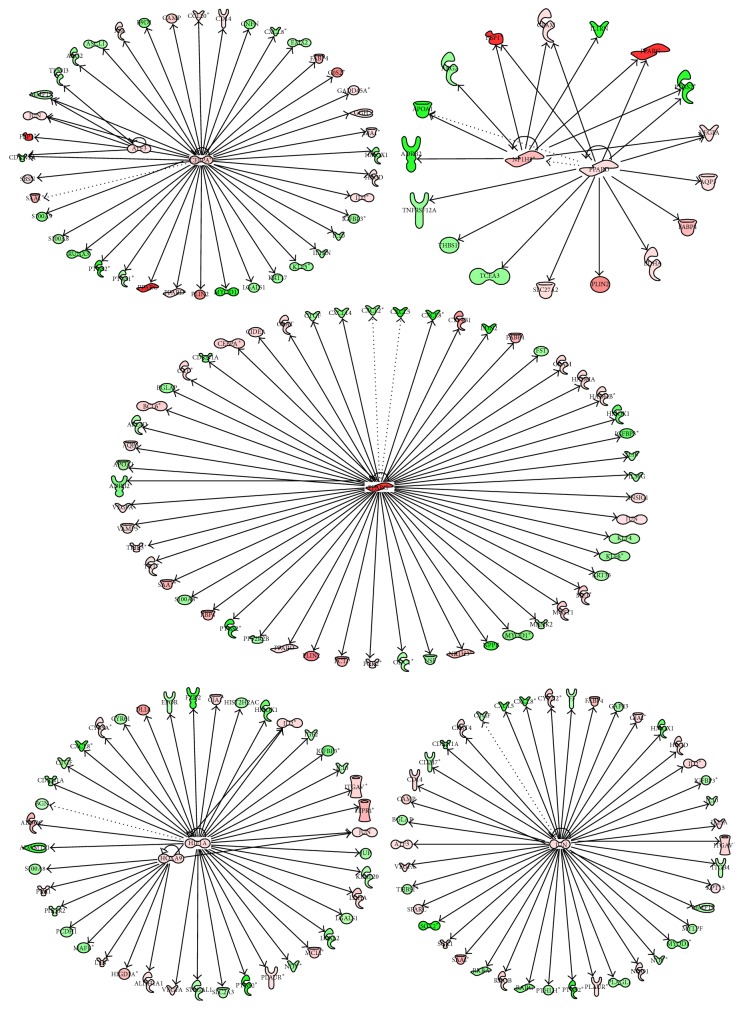
Figure 6.
Ingenuity pathway upstream network analysis of differentially expressed genes (DEG) between cells treated with Ad-PPARG and rosiglitazone and those with Ad-GFP. Only upregulated transcription factors are shown in this network. Upstream regulators are located at the center of the network and downstream genes are located in the periphery. In the network, their downstream genes are also reported. The description of the color background and arrows in this figure is the same as Figure 5.

