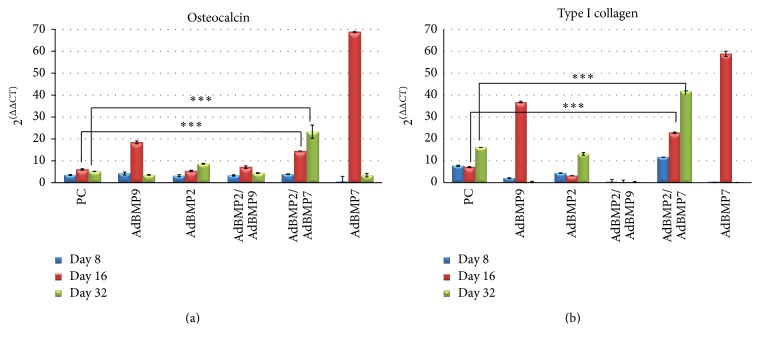
Figure 1.
Relative expression analysis of (a) osteocalcin and (b) type I collagen by qPCR of MSCs transduced with AdBMP-2, AdBMP7, AdBMP9, and the combinations AdBMP2/AdBMP7 and AdBMP2/AdBMP9 on days 8, 16, and 32 after induction. The combination AdBMP2/AdBMP7 shows higher levels of osteocalcin and osteopontin and these were maintained for 32 days. ∗∗∗significance level P < 0.05.

