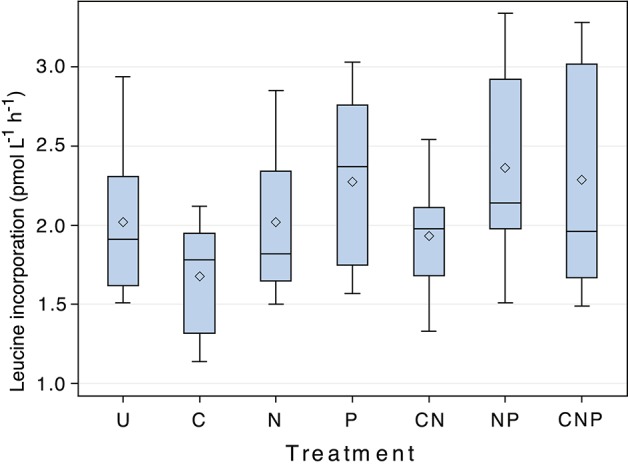
Figure 2.

The response of leucine incorporation to nutrient amendment. Results of ANOVA analysis of the response of leucine incorporation to nutrient amendment, grouped by nutrient treatment. U = unamended control, C = Carbon, N = Nitrogen, P = Phosphorus. The mean and median for each treatment are indicated by the diamond and straight line, respectively. Each bar accounts for the variability associated with each treatment through time. Differences between treatments were significant (F = 23.02, p < 0.001, d.f. = 6).
