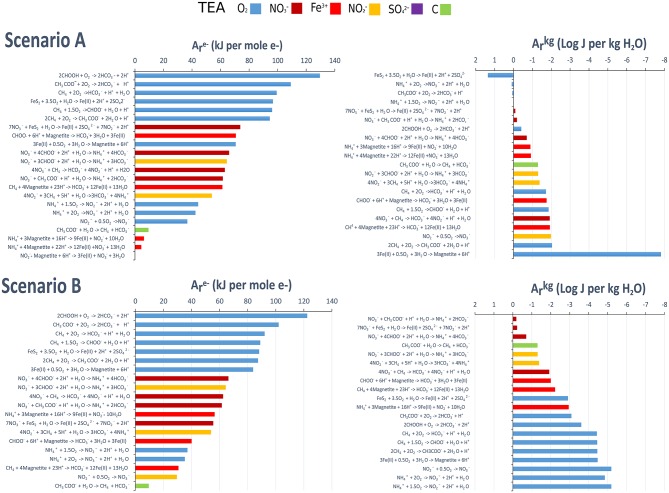
Figure 4.
Available chemical energy for potential metabolic reactions in the SLW water column. Reaction choices were based upon the presence of reactants and products in SLW. The left hand panels show ranked (high to low) Gibbs energies in units of kJ per mole of electron transferred [A (kJ per mole e−)]. The right hand panels show ranked (high to low) Gibbs energies of reaction as energy densities [A (Log J per Kg H2O)]. Scenario A: Observed lake conditions (O2(aq) inclusive = 58 uM. pE = 6.45). Scenario B. Simulated midly anoxic. O2(aq) set at 1 nM. pE = 2. See Methods section for full details.

