
Figure 1. A C. elegans gene‐centered PDI network for 15% of all genes.
-
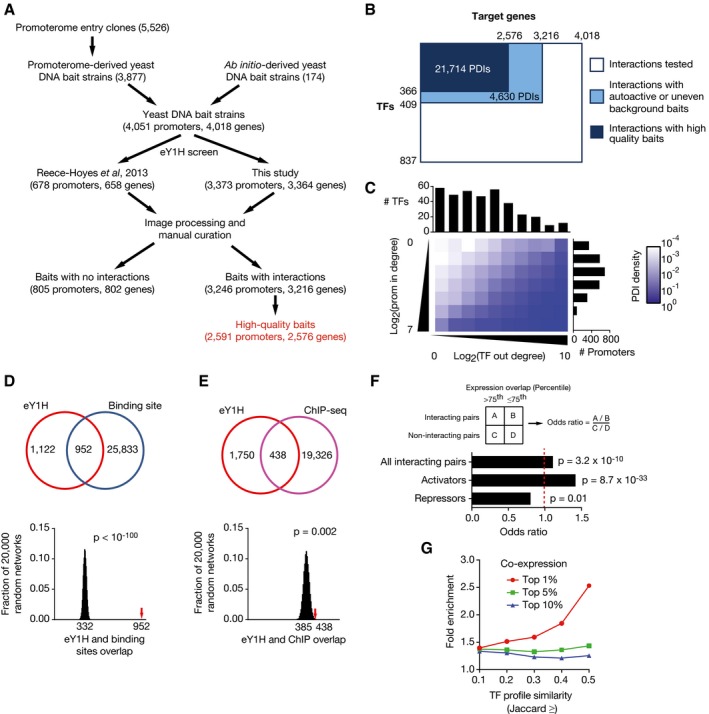
AFlow diagram for yeast DNA bait generation and screening in eY1H assays.
-
BPDI test space. Promoters of 4,018 C. elegans genes were screened using eY1H assays against an array of 837 TFs (˜90% of 941). Highly auto‐active (or uneven background) DNA baits and those that did not produce any interactions were removed (805). Interactions for DNA baits with moderate auto‐activity or uneven background are included in Dataset EV1, but were excluded from the network (light blue). The final network contains 21,714 PDIs between 2,576 genes and 366 TFs.
-
CMatrix representation of the PDI network. TF out‐degree (x‐axis), that is, the number of promoters a TF binds, and promoter in‐degree (y‐axis), that is, the number of TFs that bind a promoter, were binned in log2 scale. Each box in the matrix represents the density of PDIs calculated as the number of PDIs in the bin divided by the number of PDIs tested (i.e., the number of TFs multiplied by the number of promoters in that bin). Histograms on top and right of the matrix represent the number of TFs and promoters in each bin respectively.
-
D, EeY1H interactions significantly overlap with the occurrence of known TF binding sites (D) or ChIP‐seq interactions (E). The Venn diagrams (top) illustrate the number of overlapping interactions. The eY1H PDI network was randomized 20,000 times by edge switching, and the overlap for each randomized network was calculated (bottom). The numbers below the histogram peaks indicate the average overlap in the randomized networks. The red arrows indicate the observed overlap in the real eY1H network. Statistical significance was calculated from z‐score values assuming a normal distribution for the randomized networks.
-
FOverlap between spatiotemporal expression patterns between TFs and their eY1H target genes. The fraction of TF‐gene pairs with an expression overlap above the 75th percentile was compared between interacting and non‐interacting pairs. The same analysis was performed for known activators and repressors. Statistical significance was determined by chi‐square test.
-
GCo‐expression between genes bound by similar sets of TFs in a compendium of 123 expression profiling datasets. The enrichment of top 1, 5, and 10% co‐expressed gene pairs was determined for gene pairs with a TF profile similarity above the indicated Jaccard value. Only promoters bound by three or more TFs, and TFs that bind < 5% of promoters were considered in this analysis. P < 0.01 for all data points by Fisher's exact test.