
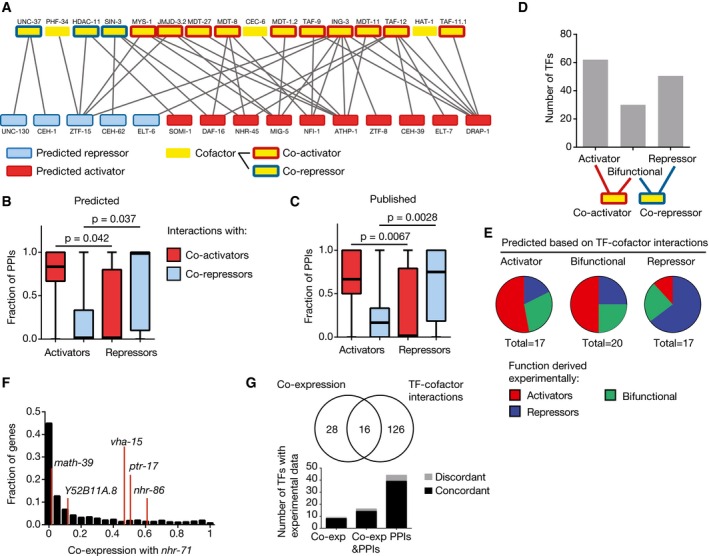
Figure 4. Regulatory function predictions based on TF–cofactor protein–protein interactions.
-
ATF–cofactor protein–protein interaction network from Reece‐Hoyes et al (2013) for predicted activators and repressors. Blue, predicted repressors; red, predicted activators; yellow, cofactors; blue outline, co‐repressors; red outline, co‐activators.
-
B, CRelationship between TF and cofactor functions. The fraction of protein–protein interactions (PPIs) with co‐activators and co‐repressors was determined for each predicted (B) or published (C) activator and repressor. Each box spans from the first to the third quartile, the horizontal lines inside the boxes indicate the median value, and the whiskers indicate minimum and maximum values. Statistical significance determined by two‐tailed unpaired Student's t‐test.
-
DTF functional predictions based on TF–cofactor interactions. TFs were classified as potential activators if they only interact with co‐activators, as repressors if they only interact with co‐repressors, and bifunctional if they interact with both.
-
EExperimentally derived functions from the literature and this study are shown for predicted activators, repressors, or bifunctional TFs based on TF–cofactor interactions.
-
FDistribution of co‐expression scores between nhr‐71 and genes that are not targets in eY1H assays (black histogram) and eY1H targets (red lines).
-
GOverlap between TF regulatory predictions based on integrated eY1H and co‐expression data or TF–cofactor interactions, and experimentally derived data. Black bars indicate the number of predictions that are concordant with experimental data.