
Figure 8. Complex epistatic relationships between NHR‐102 and NHR‐142.
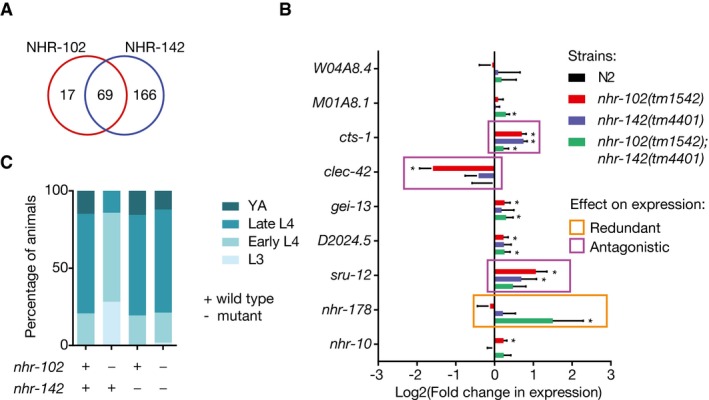
- Overlap in the number of eY1H targets between NHR‐102 and NHR‐142.
- qRT–PCR analysis of shared targets between NHR‐102 and NHR‐142 in single‐ and double‐mutant animals. Values indicate the log2 fold change compared to N2. Error bars indicate the standard error of the mean in four biological repeats. *P < 0.05 vs. N2 by two‐tailed paired Student's t‐test. Redundant and antagonistic relationships were tested by two‐way ANOVA with repeated measures. Significant interaction terms between target gene expression in the two mutant backgrounds (P < 0.05) are squared.
- Developmental progression of animals at 45 h post‐L1 synchronization of N2, nhr‐102(tm1542), nhr‐142(tm4401), and double mutants. Data are representative of four experiments.