
Figure 1. Determination of cell counts using the histone abundance for normalization.
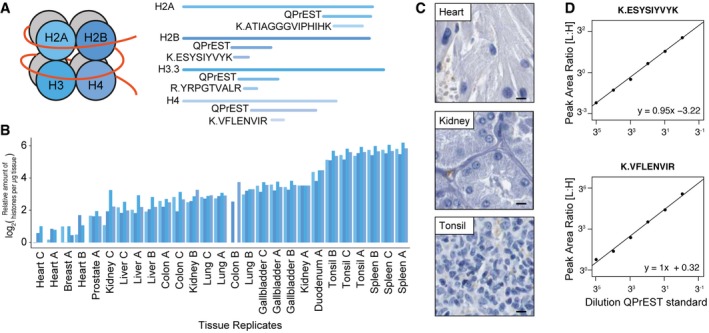
- The core histones and overview of the corresponding QPrEST and peptide standards mapped out on the protein sequence.
- Relative quantification of all four histone proteins in each tissue replicate (order of appearance per replicate: H2A, H2B, H3.3, and H4).
- Immunohistochemistry images from the Human Protein Atlas (http://www.proteinatlas.org) for protein ANXA1 with nuclear staining (blue) for three selected tissues (scale bars = 100 μm).
- Calibration curves for two of the four histone peptides, with decreasing amount of QPrEST standard spiked into a U2OS cell lysate.