
Figure EV3. RNA‐to‐protein ratios for proteins with different subcellular compartments.
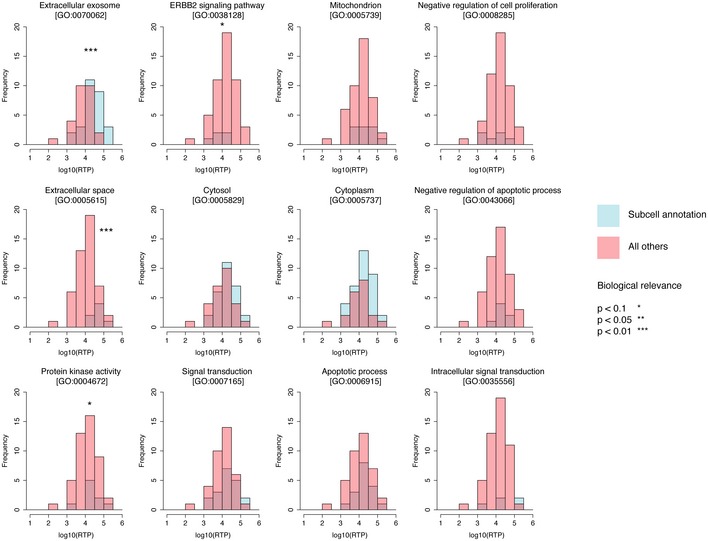
The number of GO‐annotated (UniProt, August 1, 2016) proteins in each compartment with a given RTP ratio is plotted (blue) with all other proteins not annotated to this compartment (red). P‐values are calculated using Student's t‐test.