
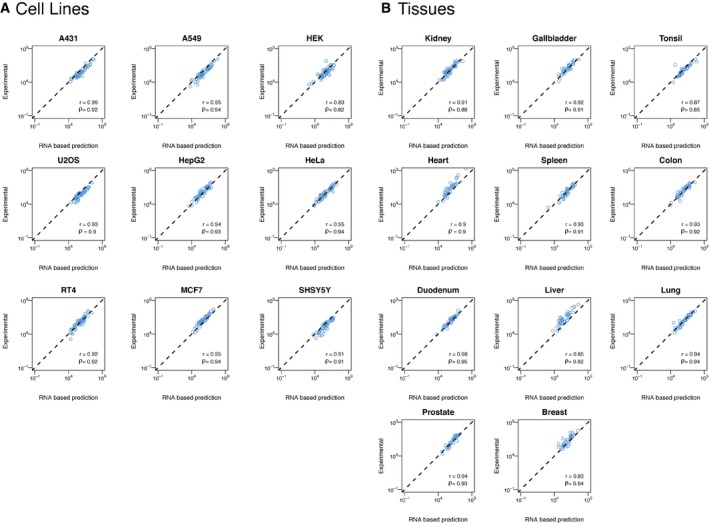
Figure EV5. Prediction of protein levels based on TPM levels as compared to the experimentally derived protein copy number for all quantified genes in all cell lines and tissues.
-
A, BThe gene‐specific correlation between protein copy number (x‐axis) and predicted protein copy number based on the RNA levels (RNA‐based prediction, y‐axis) in all cell lines (A) and tissues (B). The Spearman's (ρ) and Pearson's (r) correlations between the two values across the quantified genes are shown.