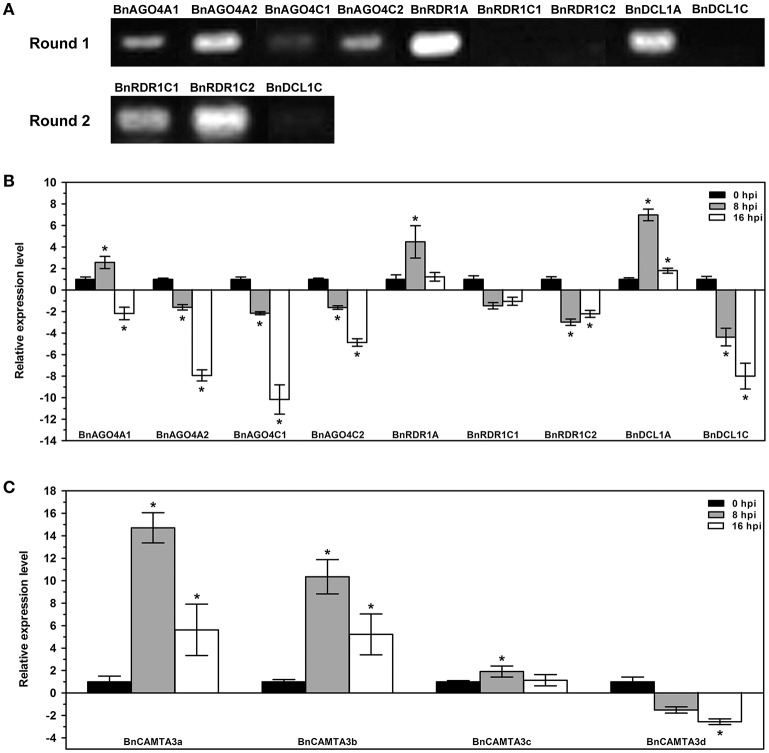
Figure 5.
Expression profiles of B. napus AGO4, RDR1, DCL1, and CAMTA3 genes. (A) Semi-quantitative RT-PCR examination of the transcript accumulation of BnAGO4, BnRDR1, and BnDCL1 genes constitutively in B. napus leaves under normal growth conditions. Round 2 PCRs were conducted by using the products of the first round PCR as templates. (B,C) Quantitative real-time PCR analyses for expression profiles of BnAGO4, BnRDR1, and BnDCL1 genes (B) and BnCAMTA3 genes (C) in response to Sclerotinia sclerotiorum inoculation in B. napus leaves. Expression of these genes at 8 and 16 hpi was shown relatively to that at 0 hpi. The experiments were conducted three times, each containing three replicates for all genes. The expression data were statistically analyzed using SPSS software. Significance of the differences between mean values was determined with Student's t-test. Error bars represent SD, while asterisks (*) indicate significant difference at p < 0.05.

