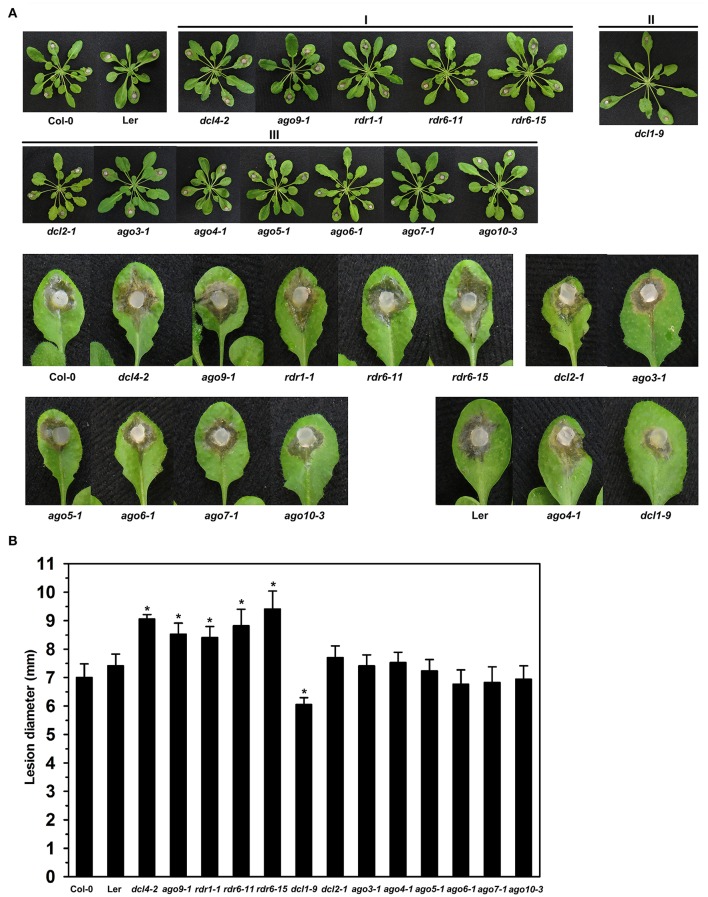
Figure 6.
Susceptibility to S. sclerotiorum in Arabidopsis dcl, ago, and rdr mutants. (A) Disease symptoms of dcl, ago, and rdr mutants and wild type plants after inoculation with S. sclerotiorum. Photographs were taken at 24 hpi. I, mutants exhibiting enhanced susceptibility; II, mutants displaying enhanced resistance; and III, mutants showing similar disease phenotypes to wild-type plants. (B) Statistical analysis of disease severity. The inoculation analysis was performed three times, each in at least 10 plants for all mutants. The lesion size data were statistically analyzed using SPSS software. Significance of the differences between mean values was determined with Student's t-test. Error bars indicate SD, while asterisks (*) indicate significant difference at p < 0.05.

