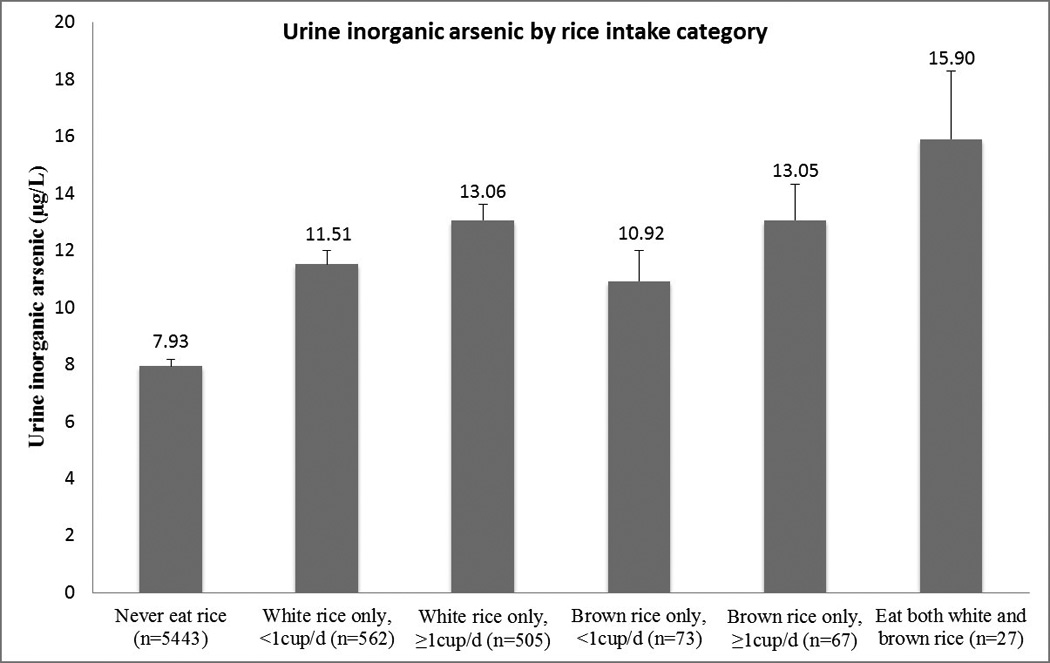
Figure 1. Urinary concentration of inorganic arsenic by category of rice consumption.

Data are geometric means (in µg/L), adjusted for age (years), gender (male/female), race/ethnicity (white/black/Mexican American/others), body mass index (kg/m2), education (less than high school/high school/higher than high school), smoking status (never smoked/former smoker/current smoker) and urine creatinine level (mg/dL). Sample size in each category: Never eat rice (n=5443); White rice only, <1cup/d (n=562); White rice only, ≥1cup/d (n=505); Brown rice only, <1cup/d (n=73); Brown rice only, ≥1cup/d (n=67); Eat both white and brown rice (n=27).
