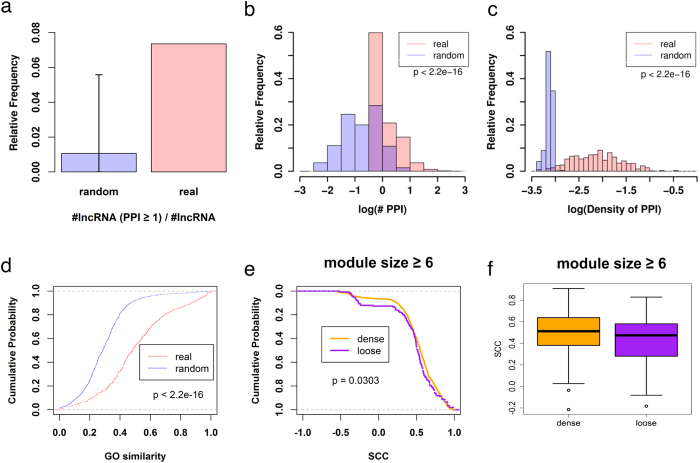
Figure 2. Functional and correlation analysis of lncRNA-associated PPI modules.
(a) Frequency of lncRNAs which co-expressed mRNAs are connected by at least one PPI in real (red) and random (blue) co-expression networks. (b) Distributions of mean number of PPIs for co-expressed mRNAs of each lncRNA in real (red) and random (blue) co-expression networks. Purple area is the overlap of the two distributions. (c) Distributions of the mean density of PPIs in real (red) and random (blue) co-expression networks. Purple area is the overlap of the two distributions. (d) Cumulative density plots for GO similarity between mRNA-mRNA pairs which are both co-expressed with a given lncRNA and connected via PPIs (red) and random pairs (blue). The p-value was calculated by the KS test. (e) Cumulative density plots for two SCC distributions of 1,257 mRNA-mRNA pairs in dense modules and 151 mRNA-mRNA pairs in loose modules. The p-value was calculated by KS test. (f) The mean of SCC for all mRNA-mRNA pairs in 106 dense modules and 33 loose PPI modules.

