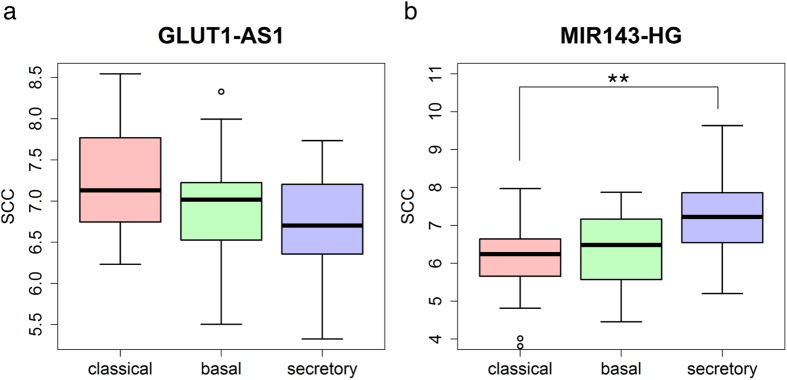
Figure 6. Comparison of the expression of GLUT1-AS1 and MIR143HG among lung cancer subtypes.
(a) The expression levels of GLUT1-AS1 in classical (red), basal (green), and secretory (blue) lung cancer subtypes. (b) The expression levels of the MIR143 host gene in classical (red), basal (green), and secretory (blue) lung cancer subtypes. The p-value was calculated by the KS test (**p < 0.01).

