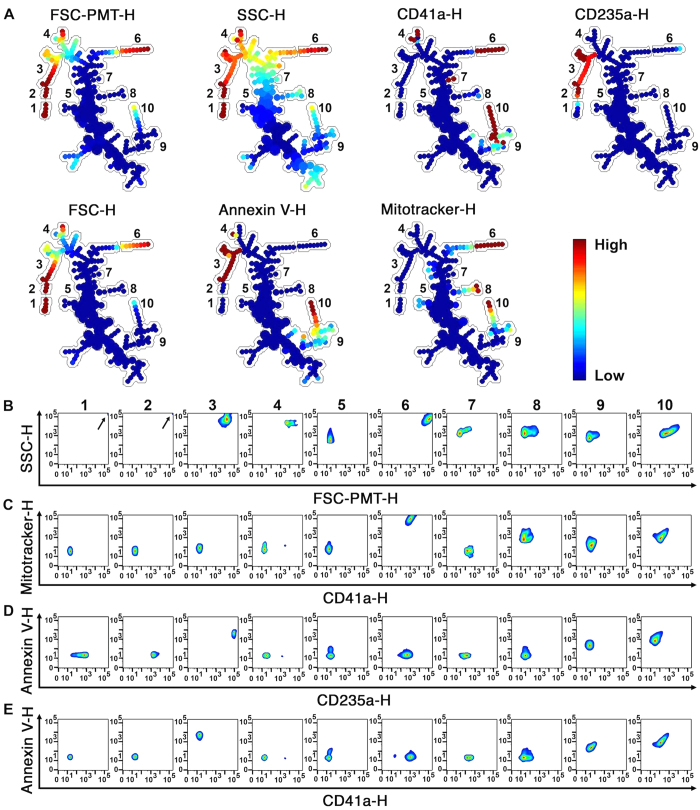
Figure 3. SPADE analysis of human blood cells and EVs.
(A) SPADE tree derived from RBC, platelets and EVs from healthy human blood cells using FCS files obtained by hs-FCM analyses. Each tree is colored according to the indicated marker. Mean fluorescence intensity ranging from low (blue) to high (red) was used to identify 10 different subpopulations (1–10) described in the text. (B–E) Events from the different subpopulations identified in trees were represented by classical analysis with bivariate plots showing (B) size and granularity, (C) CD41a and MitoTracker expression, (D) annexin V and CD235a expression or (E) CD41a and annexin V expression. (B) Arrow indicates highest cellular population in FSC-PMT-H and SSC-H. Data were generated using cells and EVs from 3 independent experiments. FCS data from the independent experiments were integrated by SPADE to generate trees.

