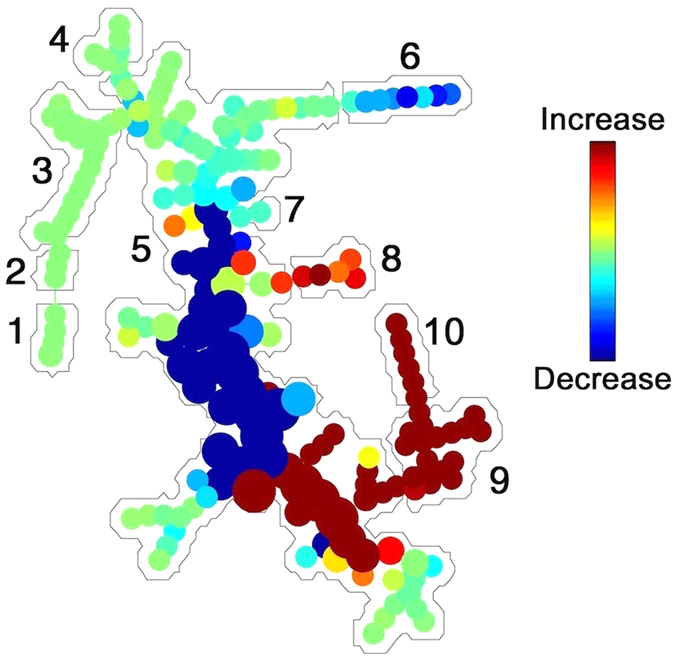
Figure 4. SPADE tree to assess EVs in cellular perturbations.

After stimulation of platelets with thrombin, cell frequency decrease (blue) in platelets (1) and increase (red) in platelet EVs (9–10). Red blood cell markers (CD235a) (2,3), other cells (1), and noise/background (5) were mostly unchanged. Platelet CD41a+ EVs (9,10) and extracellular mitochondria lacking CD41a+ (h, naked mitochondria) were induced (red). Data are representative of 3 independent experiments.
