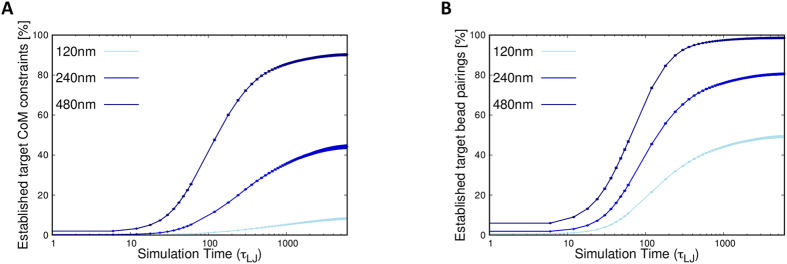
Figure 1. Evolution of the satisfied target constraints.
The curves show the increase of the percentage of target contacts that are established in the steering dynamics of the model IMR90 genome. Different proximity criteria for defining contacts are used for the two panels: (A) proximity of the centers of mass of the target regions, which are 100 kb-long and span 33 beads, (B) proximity of the closest pair of beads in the target regions. The latter contact definition is arguably closer in spirit to the chromosome pairings which, quenched by ligation, contribute to Hi-C contacts. For each panel, the curves correspond to various cutoff distances: 120 nm, 240 nm and 480 nm.

