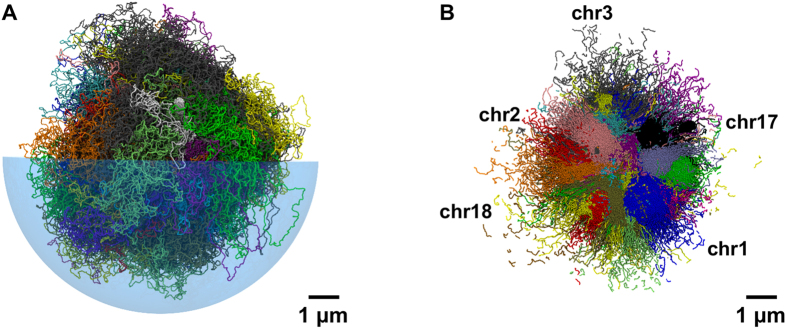
Figure 2. Spatial arrangement of chromosomes based on Hi-C data in lung fibroblast cells (IMR90).
(A) Typical chromosomal spatial arrangement obtained applying the initial phenomenological radial positioning of ref. 50 and the steering dynamics based on the Hi-C data in ref. 11. Different colors are used for different chromosomes. For visual clarity only one half of the enveloping nuclear boundary is shown, and it is rendered as a transparent hemisphere. (B) Tomographic cut of the chromosomal system shown in panel A. The planar cut has a thickness of 150 nm.

