
Figure 4. Nuclear positioning of functionally-related genomic regions in lung fibroblast cells (IMR90).
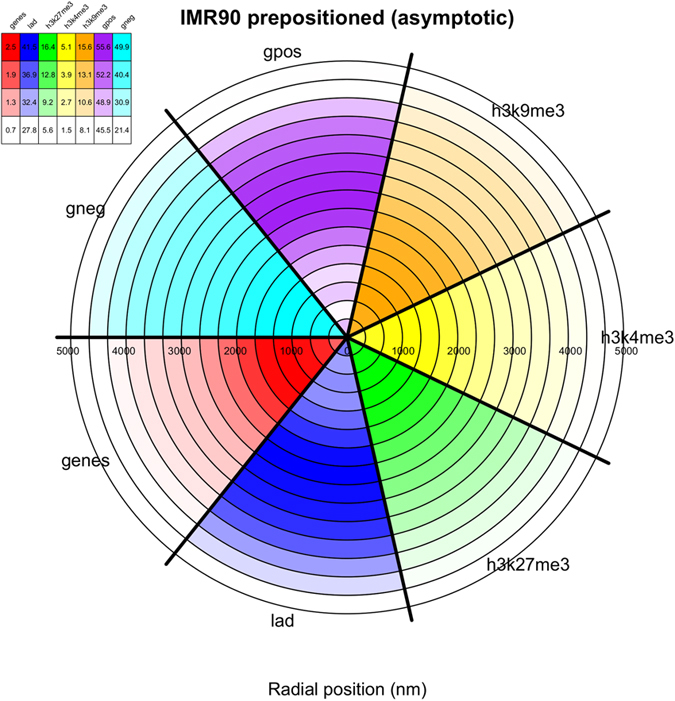
The central histogram gives the relative density percentage based on H3K9me3 (orange), H3K4me3 (yellow), H3K27me3 (green), LADs (blue) and genes (red), and negative (cyan) and positive (purple) Giemsa staining bands. Circular slices indicate radial position (in nm) within the bounding nucleus aggregated across all 10 replicate simulations. The legend indicates the percentage of beads associated with the given feature relatively to the total number of beads in the given radial shell.