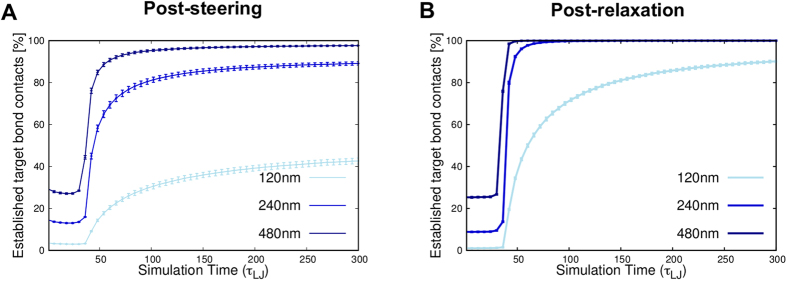
Figure 7. Time-evolution of the satisfied recondensation constraints.
The panels show the increase of the percentage of target contacts that are established during the recondensation dynamics starting from the optimally-steered conformations (A) and the relaxed conformations (B). As in Fig. 1 the curves correspond to various cutoff distances: 120 nm, 240 nm and 480 nm. We notice that the compliance to the steering is similar in the two different starting conditions.

