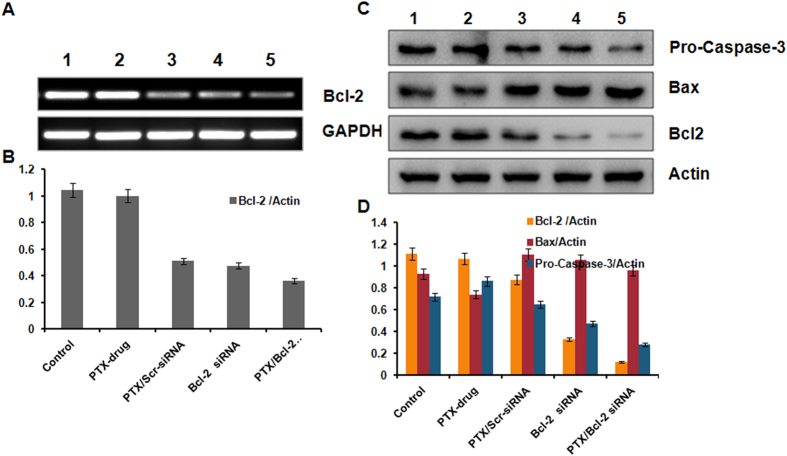
Figure 5. mRNA and Protein expressions of indicated genes and proteins involved in proliferation and apoptosis as measured by RT-PCR and Western blotting.
(A) RT-PCR studies showing the knockdown of Bcl-2 mRNA. (B) Bars represent relative Bcl-2 gene expression normalized to GAPDH (housekeeping gene as gel loading control) from same sample with SD. (C) Western blot analysis showing the elevated protein expression levels of Bcl-2, Bax & Pro caspase-3. Lane 1, Untreated Cells; lane 2, Cells treated with PTX drug; lane 3, Cells treated with liposome containing PTX & Scrambled siRNA; lane 4 Cells treated with liposomal Bcl-2 siRNA; lane 5, Cells treated with liposome containing both PTX & Bcl-2 siRNA. (D) Bars represent relative protein expression normalized to β-actin (housekeeping gene as gel loading control) from same sample with SD.

