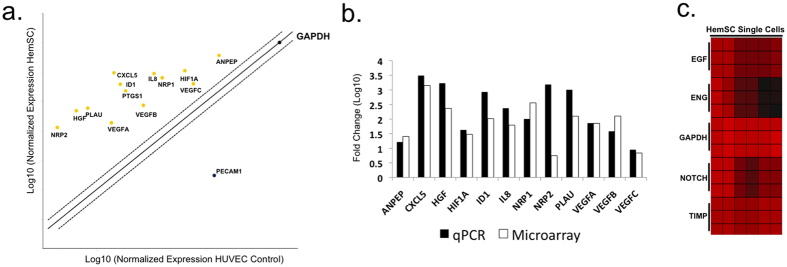
Figure 2. Gene expression analysis of angiogenesis signaling.
Agilent whole genome oligo microarrays (one-color – Cy3 labeling) and 96-well qPCR arrays (SABiosciences) were used to examine expression profiles of genes in multiple signaling pathways involved in vasculogenesis/angiogenesis, normal and tumor development (a) qPCR analysis. 96-well qPCR arrays (SABiosciences) were used to examine expression profiles of genes in sorted cell populations. Fold change/regulation was calculated using delta delta Ct method. The values were compared to fold change gene expression analysis using one-way analysis of variance (ANOVA) of samples (Partek Genomics Suite software) (Supp. Fig. 1). The scatter plot compares the normalized expression of significant genes on the array between HemSC and HUVEC (control) to exhibit large gene expression changes. The central line indicates unchanged gene expression (selected fold regulation threshold boundary set at 2). Data points in the upper left and lower right sections meet the selected fold regulation threshold. (b) Microarray and qPCR analysis of gene expression in HemSC relative to HUVEC. Microarray gene expression analysis was performed using one-way analysis of variance (ANOVA) of samples to compare the normalized expression of significant genes (in the angiogenesis signaling gene panel) between HemSC GLUT1+ and HUVEC (control). The gene list (Table 1) was created with specified criteria: 1) size of change defined as a fold change; and 2) significance of change defined as p-value with False Discovery Rate (FDR). qPCR analysis served as confirmation (Table 2). Fold change variations may be due to gene variants (for example, NRP2 reflects transcript variant 2 for qPCR [NRP2 variant 2, NM_003872] and transcript variant 1 [NRP2 variant 1, NM_201266] for microarray). (c) Single-cell gene expression. Single-cell gene expression profiles were characterized by a HT approach, fluorescence-activated cell sorting using Aria II into the wells of 96-well plates containing Platinum Taq reverse transcriptase, polymerase master mix (Invitrogen) and primers for each gene target (SABiosciences) per Fluidigm Protocol 41. The heat map represents the threshold Ct values (red indicates high expression). The rows correspond to the evaluated genes and columns correspond to individual HemSCs. The gene expression intensity data images were generated with Partek Genomics Suite Software.

