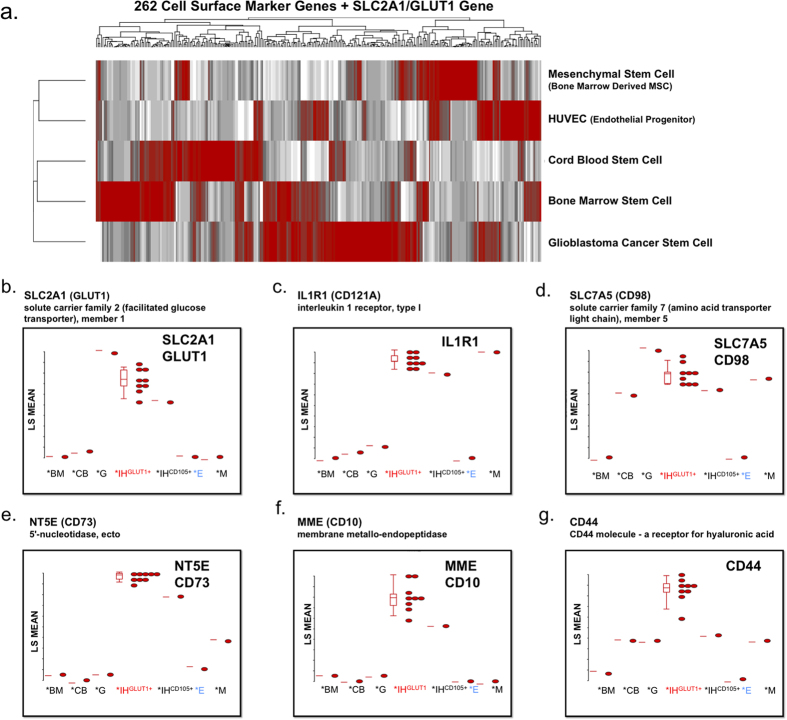
Figure 4. Global transcriptome of normal human stem and progenitor cell.
(a) Hierarchical clustering analysis of human cell surface marker screening panel. Microarrays were used to examine expression profiles of 262 cell surface marker genes and SLC2A1 (GLUT1, IH clinical biomarker) normal and neoplastic SC controls (HUVEC, Bone Marrow SC, Cord Blood SC, Mesenchymal SC, and Glioblastoma CSC). The gene expression intensity data images were generated with Partek Genomics Suite Software. (b–g) Microarray gene significance dot plot. The dot plots compare the expression of significant genes between HemSC GLUT1+ and HUVEC (control) to exhibit large gene expression changes (Bone Marrow SC - *BM, Cord Blood SC - *CB, Glioblastoma CSC - *G, HemSC GLUT1high - *IHGLUT1+, Hem ENG+− IHCD105+, HUVEC endothelial progenitor (control) - *E, Mesenchymal SC - *M) of sample gene set including SLC2A1 (GLUT1 clinical marker), NT5E (CD73), ILR1, SLC7A5 (CD98), MME (CD10), and CD44.

