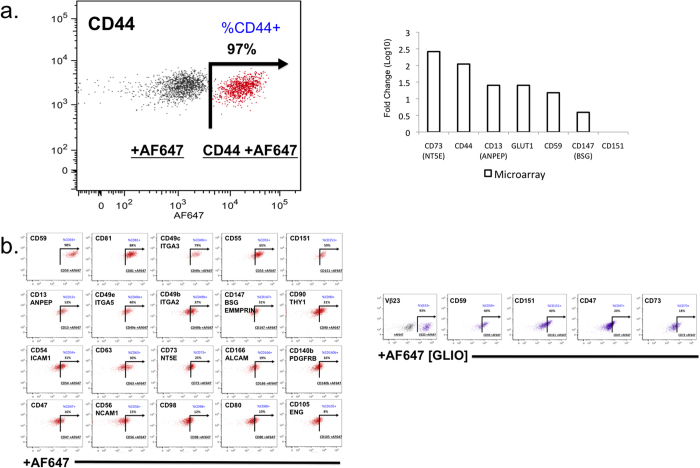
Figure 5. Analysis of human cell surface markers.
Human cell surface markers (242 monoclonal antibody screening panel including mouse and rat isotype controls from BD Lyoplate A, Lyoplate B, Lyoplate C) were analyzed by HT flow cytometry using a BD LSRII HTS and Cellomics ArrayScan HC imaging microscope. (a) Flow cytometry and Microarray analysis. CD44 is highly expressed in IH cells, as shown by flow cytometry (dot plot graph overlays) and microarray analyses. Microarray gene expression analysis was performed to compare expression of a sample set of cell surface marker genes between HemSC GLUT1+ and HUVEC (control). The fold change examines differences between proliferating vascular progenitor subsets (HUVEC) and proliferating dysregulated vascular progenitor tumor subsets (IH). (b) Flow cytometry graphs. The data represents a sample set of cell surface markers for assay development of a comprehensive panel of potential biomarkers and therapeutic targets.

