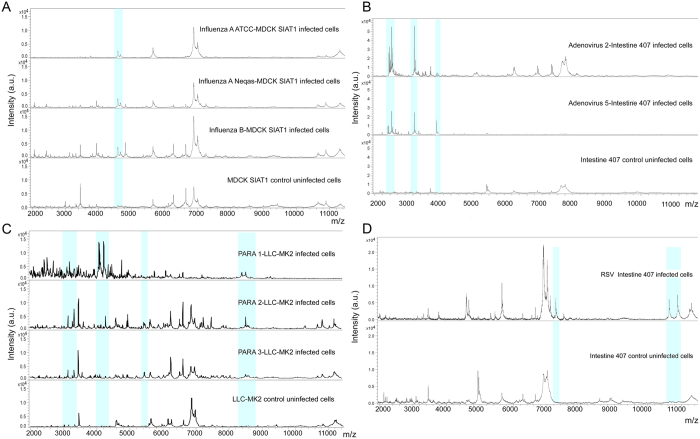
Figure 1. Representative MALDI-TOF mass spectra showing peaks in Linear Positive mode acquired in MBT-FC method analysed in the range 2–20 KDa.
(A) Detail of the spectra of ATCC and Neqas 1217 influenza A infected cell cultures (“Influenza A ATCC-MDCK SIAT1 infected cells” and “Influenza A Neqas-MDCK SIAT1 infected cells”) and Neqas 1785 Influenza B infected cell cultures (“Influenza B-MDCK SIAT1 infected cells”), compared with the spectrum of uninfected cell cultures (“MDCK SIAT1 control uninfected cells”). (B) Detail of the spectra of adenovirus type 2 and 5 reference strains both cultured in Intestine 407 cell line (“Adenovirus 2-Intestine 407 infected cells”, “Adenovirus 5-Intestine 407 infected cells”) compared with the spectrum profile of uninfected control cell cultures (“Intestine 407 control uninfected cells”). (C) Detail of the spectra of parainfluenza virus type 1, 2, and 3 cultured in LLC-MK2 cell line versus the spectrum profile of uninfected cell cultures (“PARA 1-LLC-MK2 infected cells”, “PARA 2-LLC-MK2 infected cells”, “PARA 3-LLC-MK2 infected cells” and “LLC-MK2 control uninfected cells”, respectively). (D) Detail of the spectra of RSV reference strain reproduced in Intestine 407 cell line (“RSV-Intestine 407 infected cells”) compared with “Intestine 407 control uninfected cell”. All spectra were baseline subtracted, smoothed, normalized and realigned. The x-axis shows the m/z value and the y-axis the intensity expressed in arbitrary units (a.u.) of each peak. Light blue rectangles highlight some of the peaks detected by FlexAnalysis software with a 100% frequency in all replicates and reported in Table S1.

