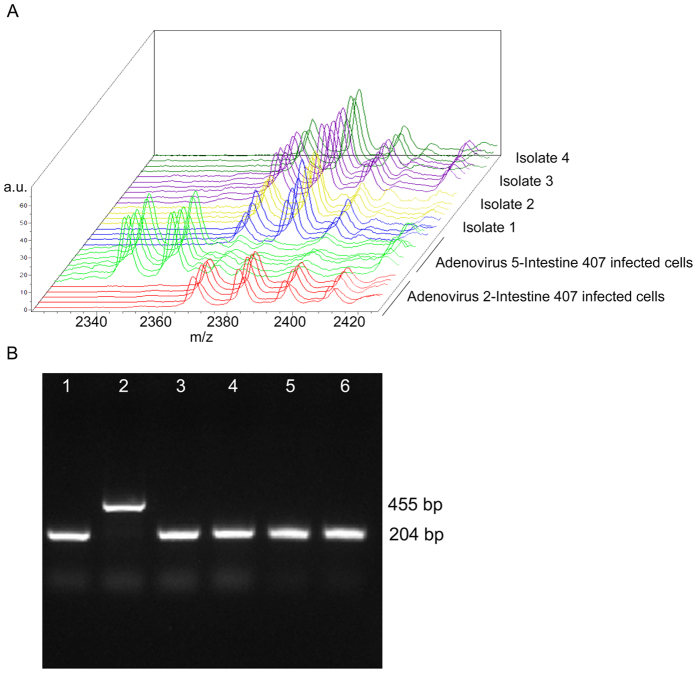
Figure 5. Example of comparative analysis of the adenovirus isolated from biological samples and the reference strains infected cell cultures.
(A) ClinProTools’ stack view displaying in a three dimensional space the spectra of six model generation classes colored according to their class membership. Reference Adenovirus 2-Intestine 407 infected cell cultures (red spectra), reference Adenovirus 5-Intestine 407 infected cell cultures (green spectra), isolate 1 infected cell culture (blue spectra), isolate 2 infected cell culture (yellow spectra), isolate 3 infected cell culture (violet spectra) and isolate 4 infected cell culture (dark green spectra). The x-axis records the m/z value, the y-axis the peak intensity in arbitrary units (a.u.) and the z-axis the loading order. (B) Polymerase chain reaction for the identification of type 2 and type 5 adenoviruses. The reaction products were analysed on 1.5% agarose gels containing ethidium bromide (0.01 mg/ml). Lane 1 reference Adenovirus 2-Intestine 407 infected cells, lane 2 reference Adenovirus 5-Intestine 407 infected cells, lanes 3, 4, 5, 6 isolate 1–4 infected cell cultures, respectively. Expected amplification products molecular weights are indicated on the right of the figure.

