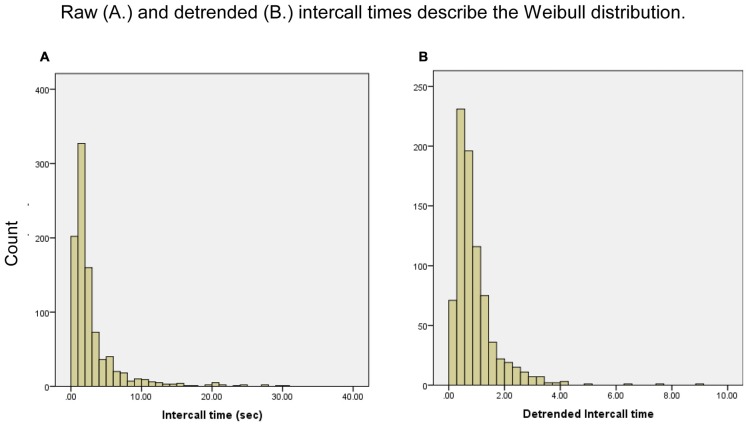
Figure 1.
Frequency distribution of intercall times, raw and detrended. Frequencies are for responses anywhere in response sequences; for example, the first bar in (A) represents all the intercall times of less than 1 s regardless of where they occurred in all participants’ sequences, from a first response to a 37th response.

