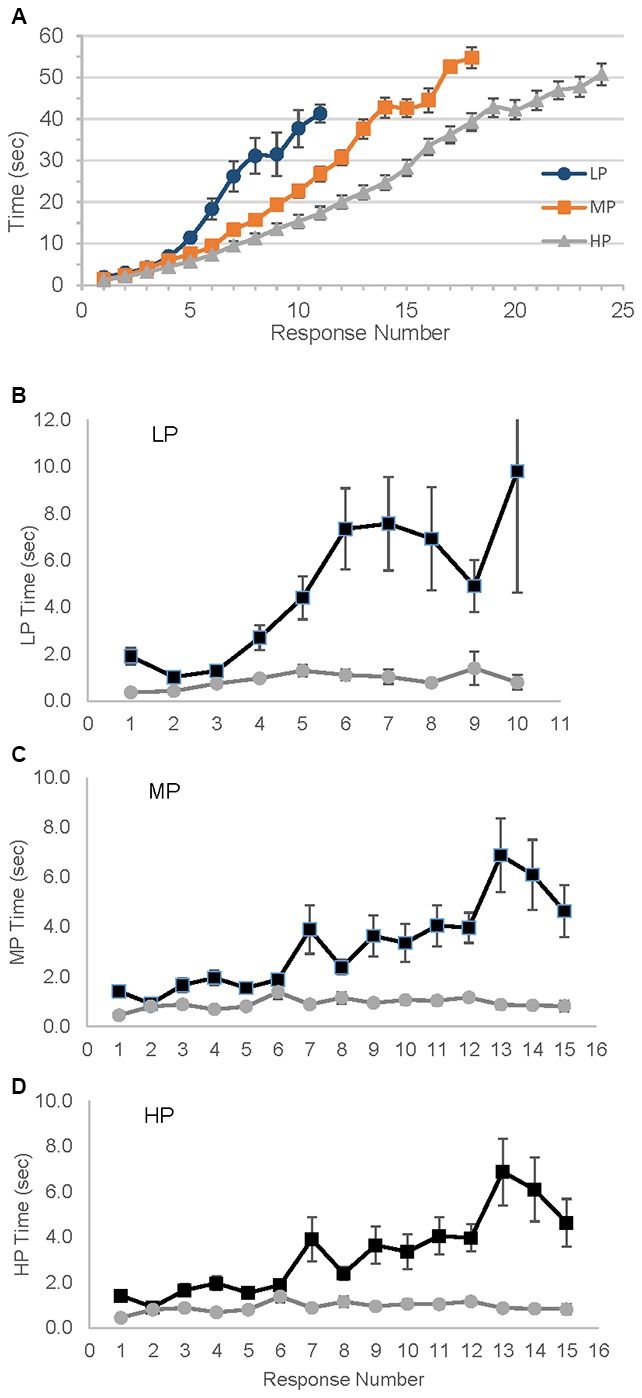
Figure 2.

Variability in time needed to produce number of responses. LP, Low performer; MP, Medium performer; HP, High performer. (A) Mean time in seconds to reach each response; error bars represent standard error. (B–D) Mean Intercall times, raw and detrended times for each group. Detrended time is unitless. ▀ Raw data,  Detrended data.
