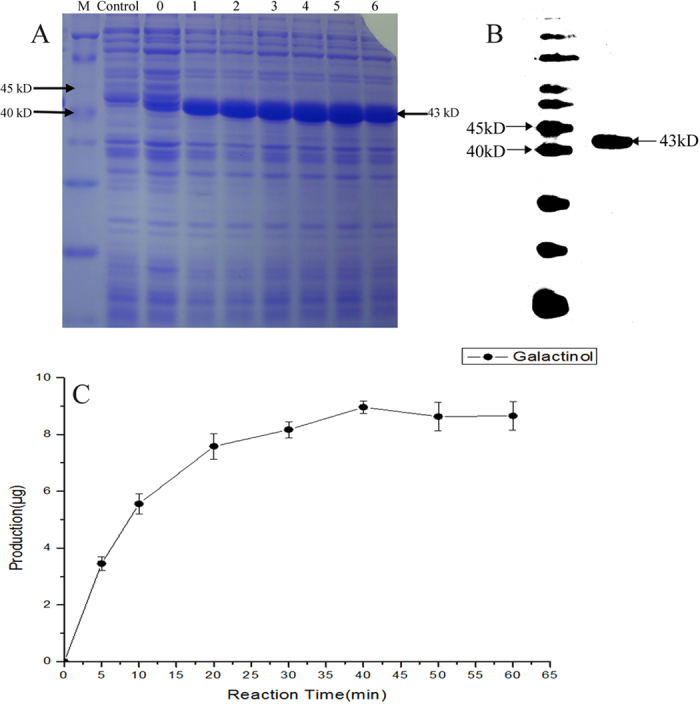
Figure 3. The induction, extraction and analysis of fusion protein enzyme activity.

(A) Extraction of the induced total proteins. M, protein marker. Control, empty vector (pET-30a+) cells were treated with IPTG 6 h. Label 0, pET-30a-AnGolS1 cells cultured for 6 h under normal conditions. Labels 1 to 6, pET-30a-AnGolS1 cells treated with IPTG for 1 to 6 h. (B) Detection of the purified fusion protein as a band of approximately 43 kD, between 40 kD to 45 kD. (C) Changes in the galactinol curve during the substrate reaction test. The horizontal and longitudinal coordinates represent the reaction time and the generation of galactinol, respectively.
