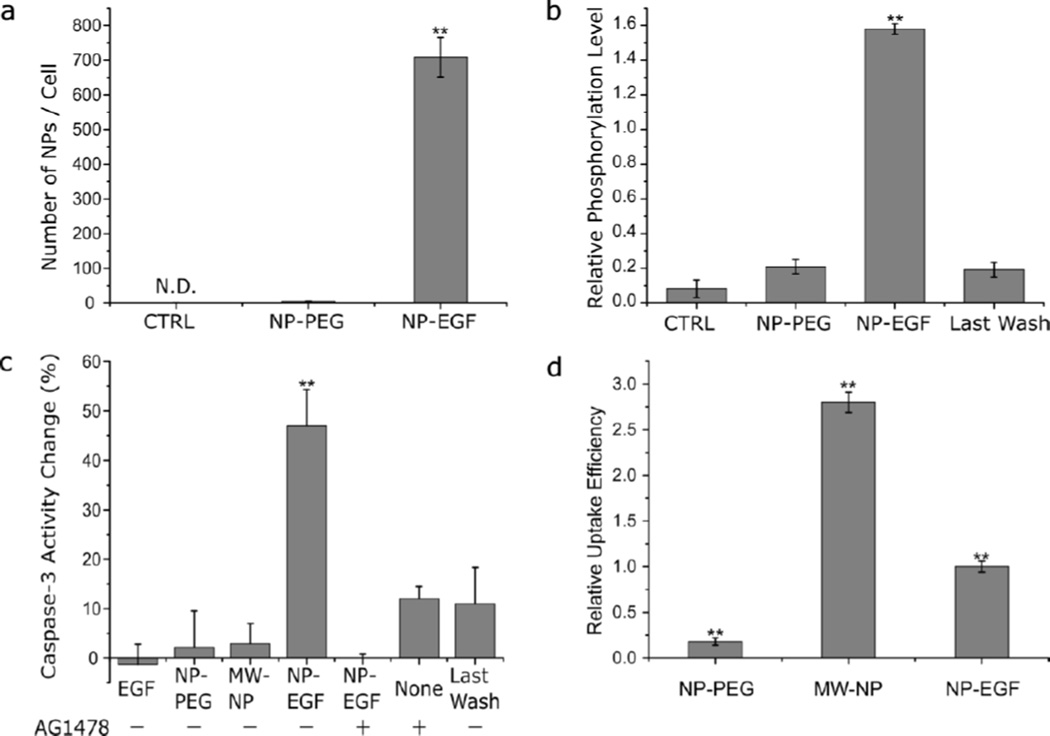
Figure 2.
Characterization of NP-EGF induced uptake, phosphorylation and apoptosis. a. Cellular uptake of NP-PEG and NP-EGF as determined by ICP-MS. MDA-MB-468 cells were incubated with NPs (8 pM) for 25 min. CTRL = no treatment control. Data were collected from 3 independent experiments. b. Phosphorylation level induced by NP-EGF. Cells were treated with (left to right) DMEM (CTRL), NP-PEG (8 pM), NP-EGF (8 pM), and the supernatant from the last wash of NP-EGF for 25 min in the incubator before they were lysed and assayed for phorsphorylated EGFR by ELISA. All data are normalized by the phosphorylation measured for free ligand EGF (1 nM) and were collected from at least 3 independent experiments. c. Change in caspase-3 activity (relative to CTRL) in %. MDA-MB-468 cells were incubated (left to right) with EGF (33 nM) peptide, NP-PEG (8 pM), membrane wrapped Au NP (32 nM), NP-EGF (8pM), supernatant from the last wash of NP-EGF through centrifugation in the presence (+) or absence (−) of AG1478 (250 nM) as indicated. The cells were incubated for 4 h and chased in fresh growth medium for 20 h. Data were collected from 6 independent experiments. d. Relative cellular uptake of NPs with 4 h incubation time. Cells were incubated with NP-PEG (8 pM), MW-NP (32 nM), and NP-EGF (8 pM) for 4h. Data were collected from 3 independent experiments. Error bars represent the standard error of the mean (SEM). Differences between multiple groups were determined by one-way ANOVA with Tukey post-hoc test (** p< 0.01).

